June, 2000
Case Study 3:
- Behaviour;
- Reproducibility;
- Effect of increased toxicity
Goals: (1) To investigate the behaviour of the system under default parameter values and understand the observations. (2) To study the behaviour of the system using various starting conditions. (3) To investigate the effect of increased toxicity of cytokines to neurons.
Method: The simulation was run several times using current default parameter values. Below are shown consecutive views of the positions of the cells and amyloid sources during one single simulation run. The changes in neuron health were plotted for the successive runs and compared
Results:
- As neurons died in the center of the domain, it often happened that the original stimulus site was eliminated. (If the neuronal tissue dies, it is assumed in the simulation that any source within it is eliminated.) If this occurred, it seemed to slow down the rate of degeneration of the neurons.
- Neuron health started to degenerate at around t=70. By t =300, neurons had lost health considerable, but were still above 65% healthy under the default parameter conditions.
- Secondary amyloid sources were formed by about t=150 or so, and were to be seen in the periphery of the dead region, in an area where the neurons were becoming stressed, but were not yet dead.
- Many of the secondary amyloid sources were themselves extinguished by death of neurons during the run.
- Individual runs showed rather different rates of deterioration. By t=300 the spread of variability was between 67% and 85% healthy, depending on the run. The reasons for this variability is still under investigation, but may have to do with the initial distribution of microglia and astrocyte which differed in the various runs.
- The rate of decline of neuronal health changed over the time span shown, tapering off to a more steady decline. This effect probably stems from saturation effects.
- At early stages, when there was a single source in the domain, microglia were rapidly attracted to it, whereas when the source was eliminated, the microglia were attracted to new sources.
Observations:
|
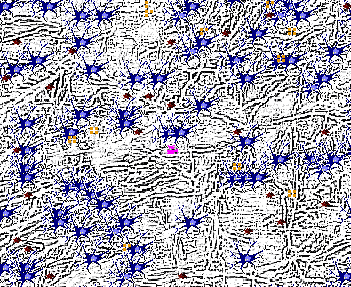
Time t=0 : At the beginning of the simulation.
|
|
Time t=100 : Many microglia have already aggregated near the initial stimulus
|
|
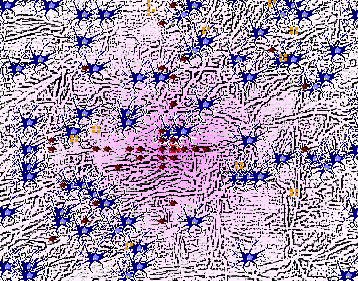
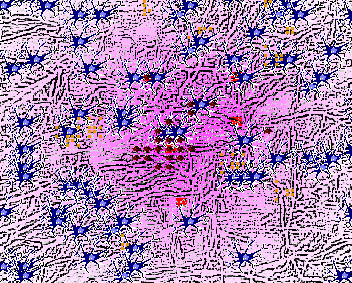
Time t=150: New sources of amyloid are seen near the center. In this case, the initial source is still evident, but in some simulations it had disappeared by this time.
The deposits of fibrous amyloid are beginning to grow just around the central region.
|
|
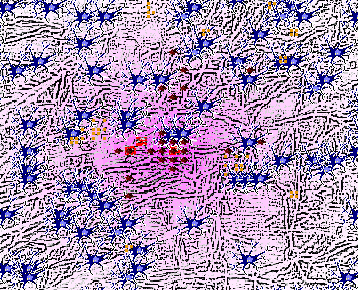
Time t=200: Some sources have been replaced by others
|
|
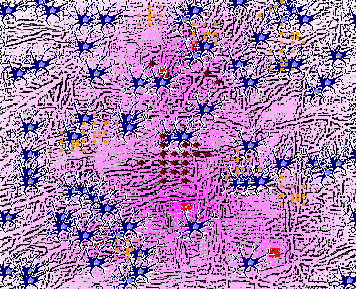
Time t=300 : The central region is necrotic, and several sources have been eliminated. Further growth of the fibrous deposits is seen. "Diffuse amyloid plaques are seen in several places in the region.
|
The graph of neuron health corresponding to this run is shown as series 7 in the graph below.
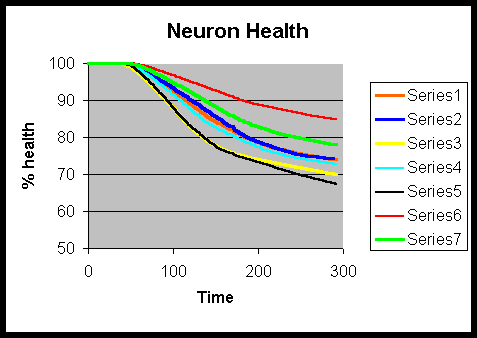
It is seen above that several runs, notably those corresponding to Series 1, 2, and 4 were very close in behaviour. Series 3 and 5 showed more significant deterioration of health, though the rate of decline was different only for the first 150 time steps, and later leveled off. Series 6 was the most outstanding in that it showed very little health decline over the given time period, followed by Series 7.
Parameter Values:
- Chemical Parameters
- diffusivity = 1499.
- source concentration = 200.0
- initial fiber occupancy = 0.01
- critical sol-AB for fibers = 50.0
- new fiber nucleation effectiveness = 1.0
- sol to fiber transition rate (times 10^(-6)) = 10.0
- Microglia Parameters
- initial microglia count = 40.0
- maximum density = 3.0
- microglia concentration = 10.0
- motility time delay = 14.0
- chemotactic sensitivity = 0.67
- half-sticking fiber level = 50.0
- half-sticking sAB level = 20000
- maximum sAB microglia uptake rate = 0.1
- half max amyloid binding conc = 15.0
- chemical breakdown = 0.01
- Cell Death: Off
- fatal dosage = 1.0
- Cell Mitosis: Off
- Astrocyte Parameters
- initial astrocyte count = 100.0
- activation level = 0.001
- maximum density = 3.0
- astrocyte concentration = 3.0
- IL-1B receptor equilibrium constant = 1.0
- IL-1B receptor unbinding rate = 0.01
- IL-1B receptors per astrocyte = 2000.
- typical cell duration = 300.0
- IL-1B Parameters
- IL-1B diffusivity = 899.6
- triggering concentration = 0.5
- IL-1B secretion rate = 0.36
- IL-6 Parameters
- IL-6 diffusivity = 810.0
- triggering IL-1B equilibrium factor = 1.0
- IL-6 secretion rate = 0.1
- TNF-alpha Parameters
- TNF diffusivity = 900.0
- triggering IL-1B equilibrium factor = 1.0
- TNF secretion rate = 0.03
- Neuron Parameters
- IL-1B receptor equilibrium constant = 1.0
- IL-1B receptor unbinding rate = 0.01
- IL-1B receptors per neuron = 2000.
- source triggering level = 100.0
- maximum IL-1B absorbed = 200.0
- IL-6 receptor equilibrium constant = 10.0
- IL-6 receptor unbinding rate = 0.04
- IL-6 receptors per neuron = 500.0
- fatal IL-6 concentration = 0.2
- TNF receptor equilibrium constant = 1.3
- TNF receptor unbinding rate = 0.01
- TNF receptors per neuron = 1100.
- maximum TNF absorbed = 10.0
- IL-1B effects on health = 0.0
- IL-6 effects on health = -1.0
- TNF effects on health = 0.5
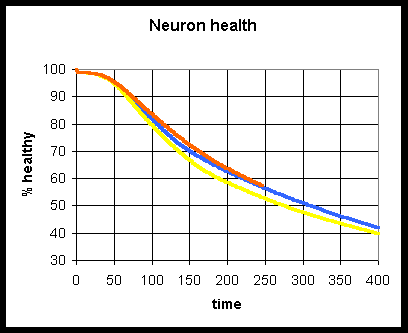
Simulation with increased toxicity due to cytokines:
The simulation was rerun with all cytokines having negative effects on health, as follows:
- IL-1B effects on health = -1.0
- IL-6 effects on health = -1.0
- TNF effects on health = -1.0
It is evident that over a period of 300 time steps, neuron health degenerated to a larger extent, as expected. The profile of neuron health over time for three such runs is shown below.