October, 2000
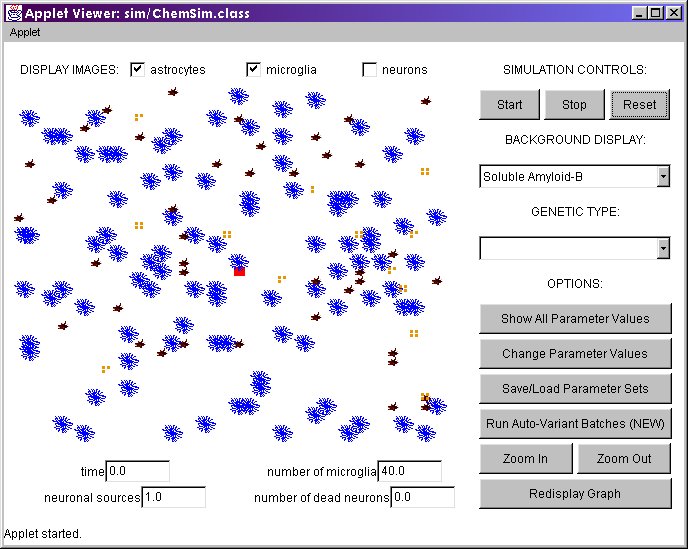
Progression of a Simulation
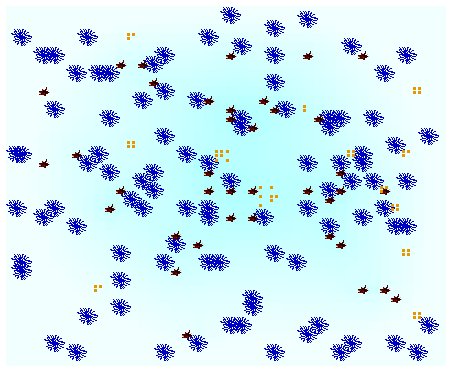
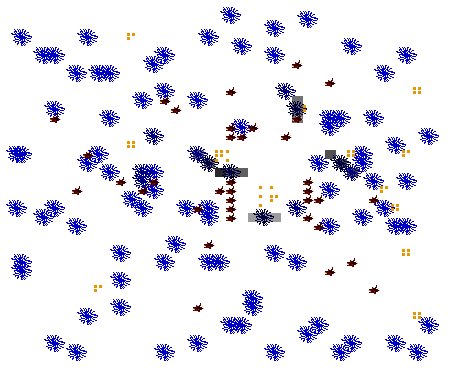
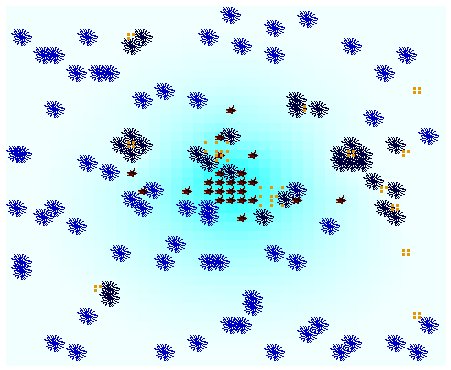
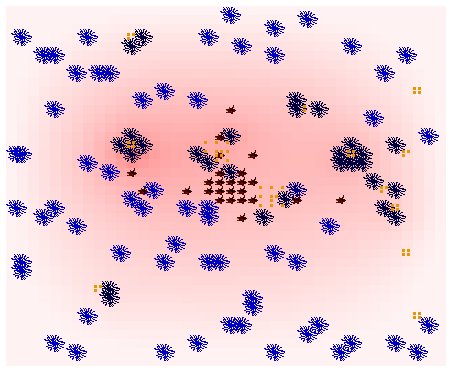
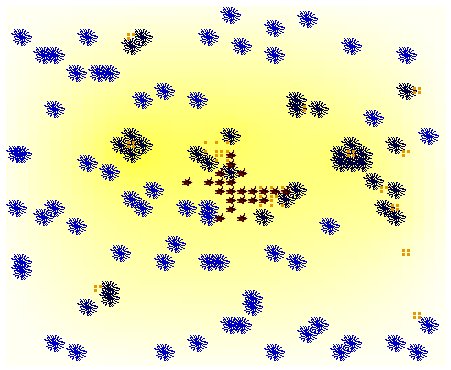
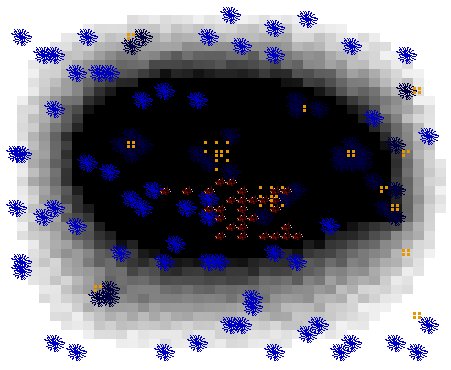
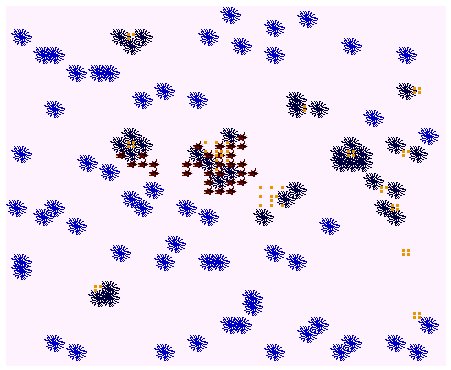
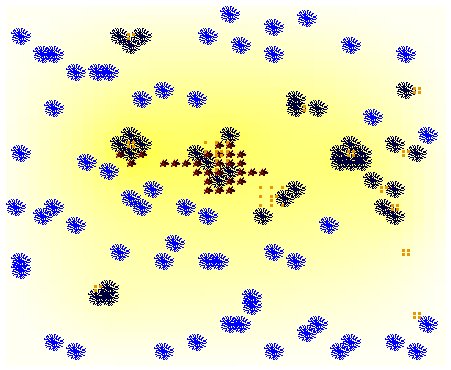
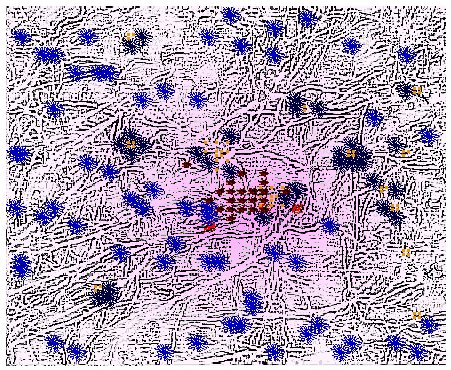
The simulation begins with a source of soluble amyloid protein
in the center (shown in red), and astrocytes (shown in blue),
microglia (shown in dark red) and amyloid fiber deposits (shown
in orange) randomly distributed throughout.
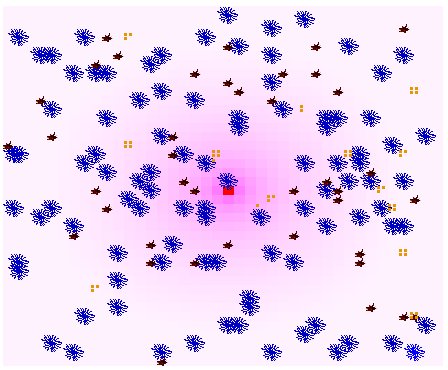
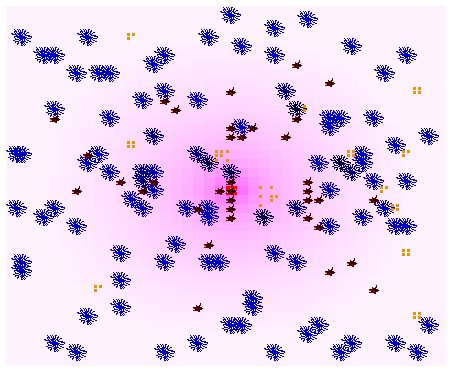
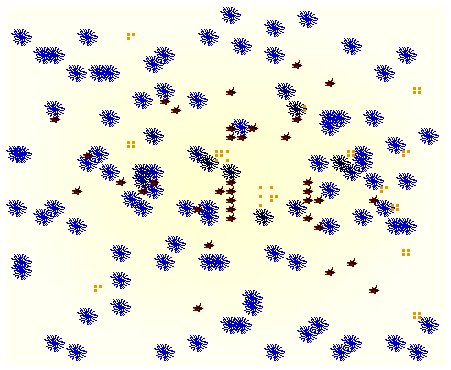
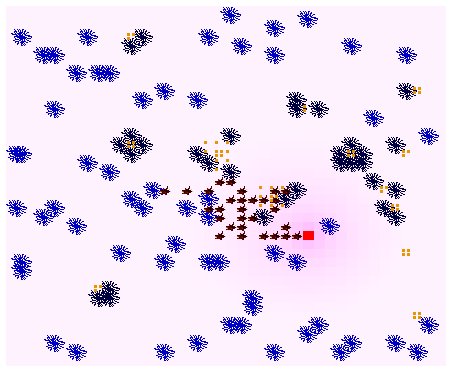
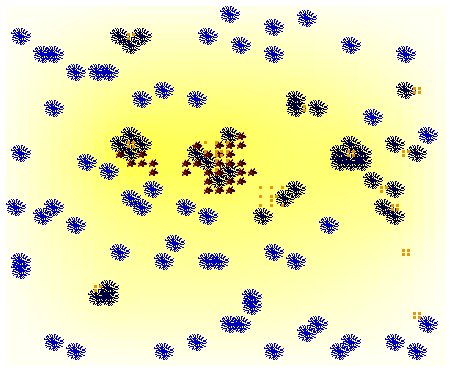
After 12 minutes, one can see that the soluble amyloid has
diffused outward from the center (shown in shades of magenta).
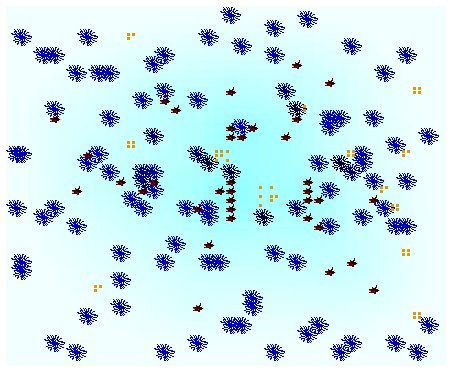
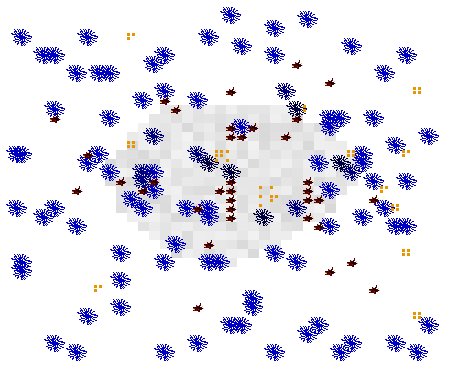
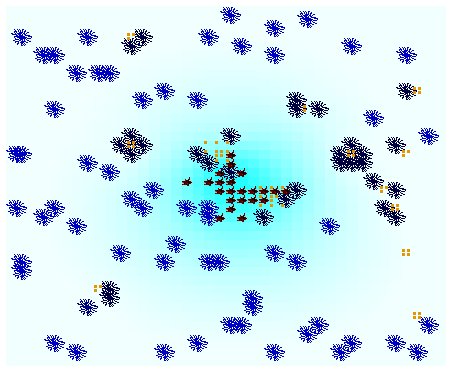
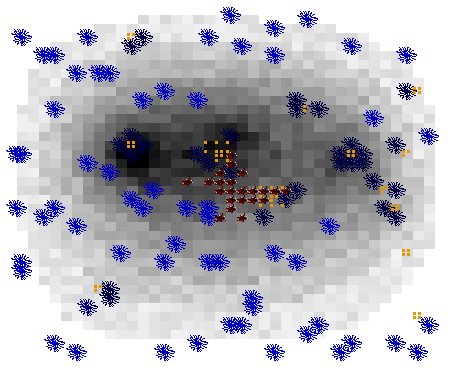
After 36 minutes, one can see that the microglia have begun
to move up the soluble amyloid gradient towards the source
of amyloid.
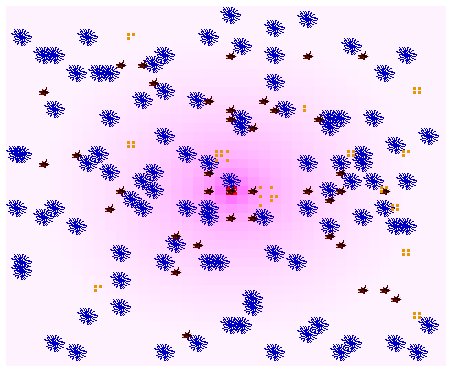
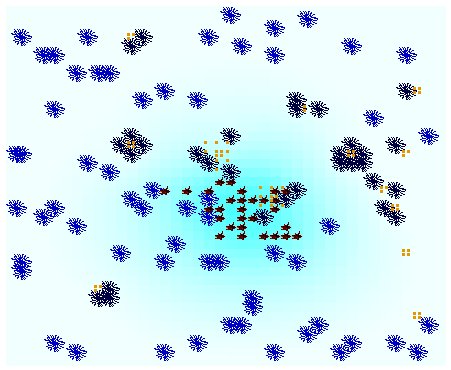
At this time, one can see that the microglia have also absorbed
enough amyloid to trigger their secretion of IL-1Beta (shown
in shades of cyan).
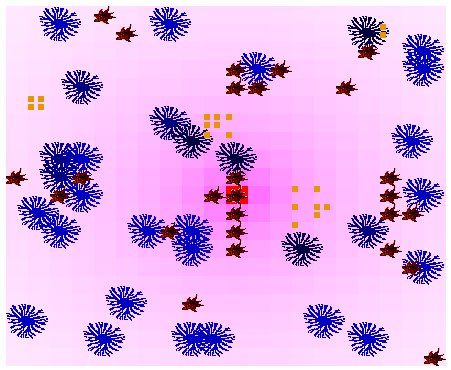
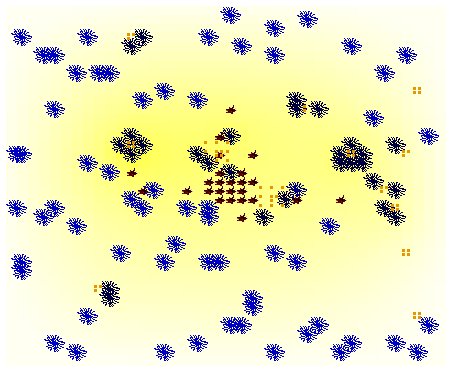
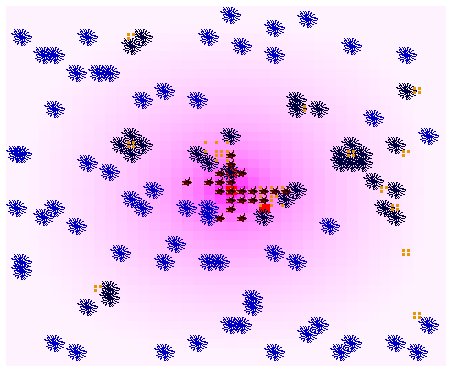
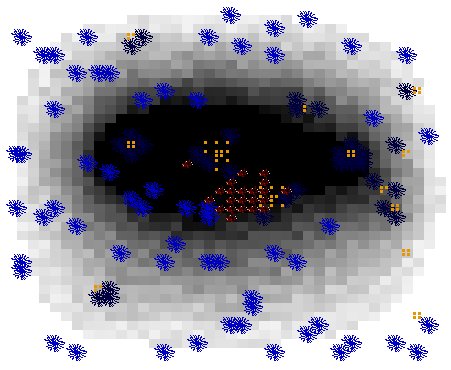
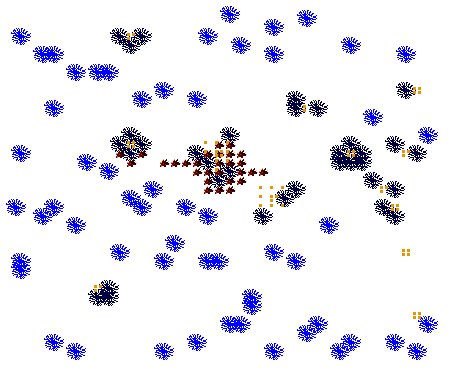
After 60 minutes, one notices that more microglia have made
their way towards the source.
The IL-1Beta has also begun to build up.
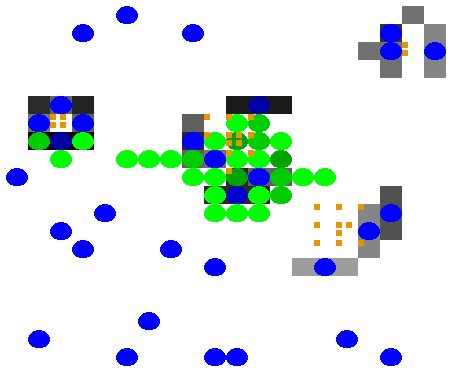
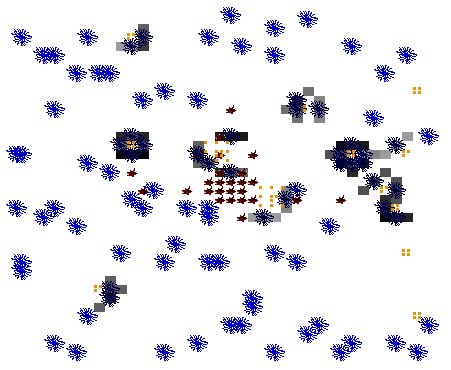
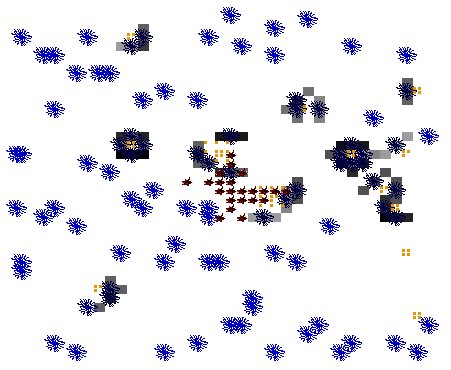
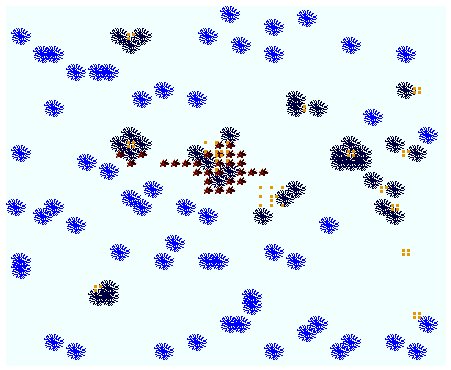
The IL-1Beta triggers astrocyte activity as evidenced in this close
up picture of the center. The lightest colored astrocytes are active.
The darkest colored astrocytes have become blockers. The shade in
between indicates that an astrocyte is in motion to become a blocker.
The blocking of astrocytes (shown in shades of gray) vary.
Astrocytes release IL-6 (shown in shades of yellow).
IL-6 is toxic to neurons and influences their health (shown in shades
of gray).
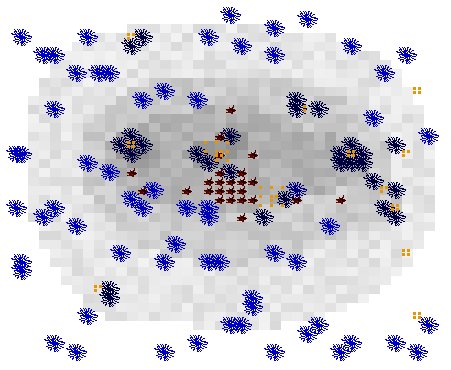
After 150 minutes most of the microglia have made their way to the
center.
With all the microglia at the center, their is a build up of IL-1Beta
at the center as well.
More astrocytes have become blockers at this time. The blocking
serves to limit the spread of amyloid fiber.
However the blocking also allows IL-6 to build up in these areas.
The build up of IL-6 causes the health of neurons to decline more
rapidly in these areas.
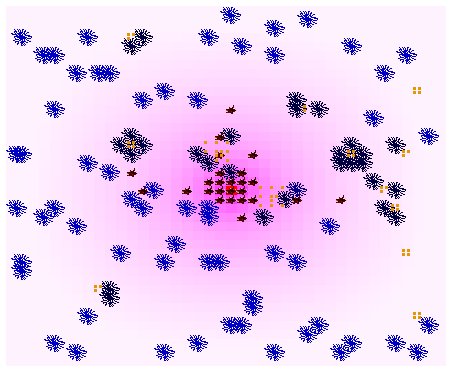
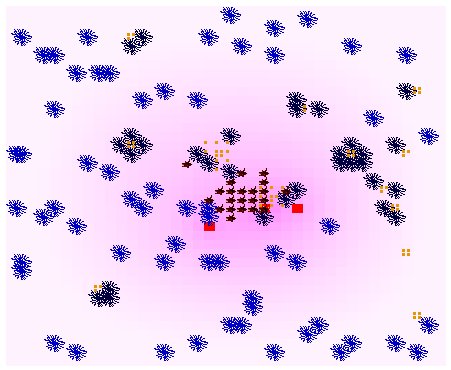
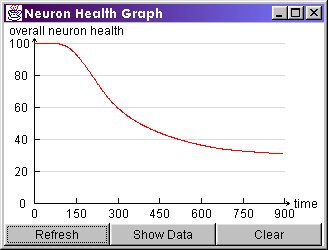
Although, the build up of TNF-Alpha (shown in shades of pink) in
these same areas does little to counteract the IL-6 as shown in
the picture of neuron health above.
After 210 minutes, the IL-1Beta is present near the center in
great quantities.
Because the neurons have absorbed enough IL-1Beta near the center,
new sources of soluble amyloid (shown as red rectangles) have been
produced.
With the spread of amyloid fibers halted for the most part, little
has changed with the astrocyte blocking. (The remaining non-blocking
astrocytes have little chance of becoming blockers because the fibers
are all out of sensing range and will continue to remain so.)
However, the build up of IL-6 is quite high at this time.
With the increase in IL-6, neurons absorb IL-6 at a faster rate which
becomes detrimental to their health.
After 270 minutes, the original source of soluble amyloid has died.
At this time, the microglia have begun to migrate towards new sources
of soluble amyloid.
After 350 minutes, the wave of neuron death is quite large.
This neuron death reduces the number of amyloid sources.
Although the microglia follow the new sources, the spread of
IL-1Beta is to localized to trigger more amyloid sources outside
the oncoming wave of neuron death.
After 600 minutes, the majority of neurons have died.
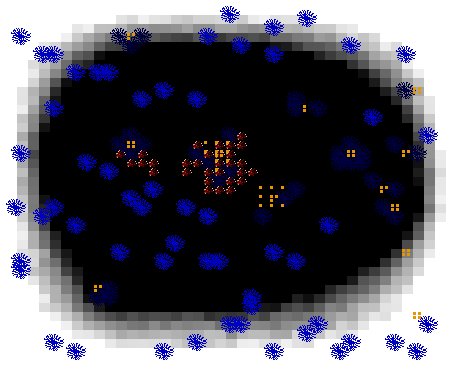
With the neuron death, sources of soluble amyloid have been eliminated
which has greatly decreased the amount of soluble amyloid present. (In
this case, the microglia tend to congregate near deposits of fiber).
With the absence of soluble amyloid, the microglia no longer produce
IL-1Beta.

However, the levels of IL-1Beta have not become low enough to halt
the secretion of IL-6 by the astrocytes.
After 900 minutes, soluble amyloid no longer exists in measurable
traces.
IL-1Beta has also all but disappeared from the system.
Although, still found in high concentrations, levels of IL-6 have
decreased now that the astrocytes do not have enough of IL-1Beta
to continue with their secretion of IL-6.
With the reduction in IL-6, neuron death has finally begun to level
off.
Of course, the fact that most of the neurons are dead also explains
the slow down in the decline of neuronal health.
Other Display Options
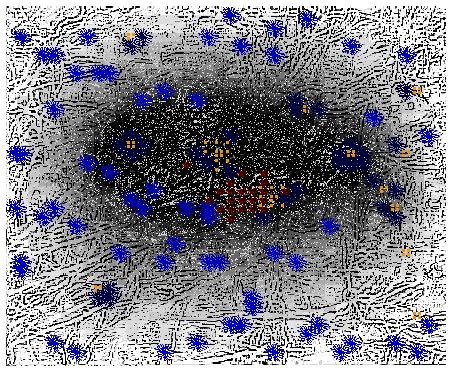
If one wants the more realistic impression of looking at a tangle
of neurons, one can view results with neurons turned on.
The picture below shows how neuron health looks at 270 minutes.
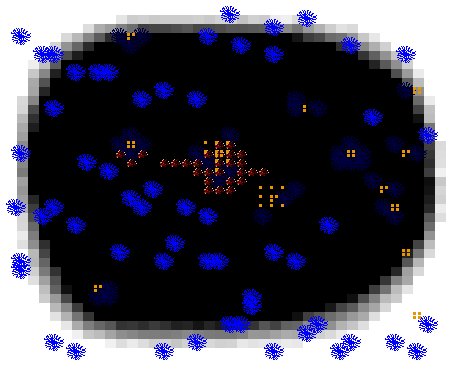
However, it is usually hard to see the different levels of chemicals
with neurons turned on as evidenced by the following picture of
soluble amyloid at 270 minutes.
Just as neurons can be displayed, there is also an option to turn
off the fancy display for astrocytes and microglia. The following
picture shows astrocytic effects near the center of the simulation
region (zoomed in) at 900 minutes.
Astrocytes are shown in shades of blue while microglia are shown
in shades of green. Darker shades mean higher densities.