The diffraction pattern observed with light and a small slit comes up in about every high school and first year university general physics class.
The intention of this web page is to explain this pattern at the academic level mentioned above.
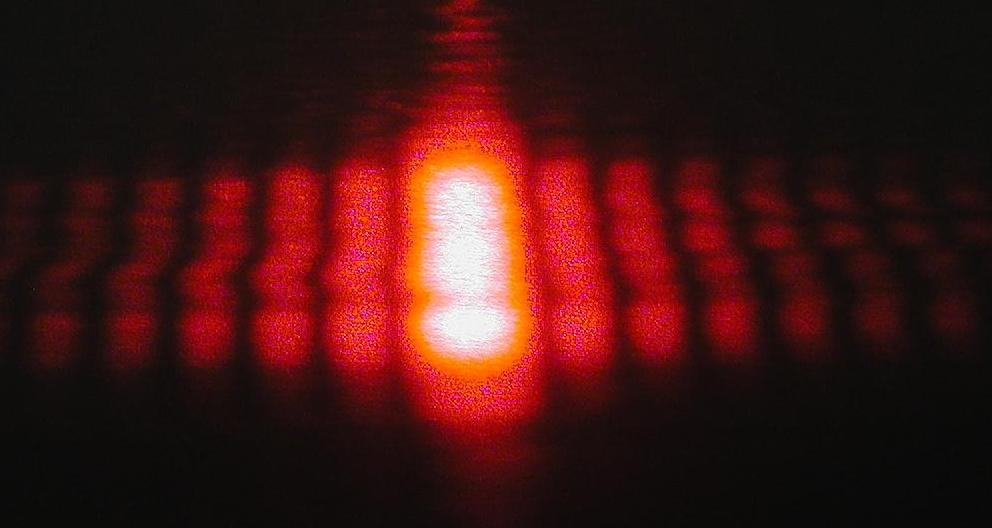
Left: picture of a single slit diffraction pattern.
Light is interesting and mysterious because it consists of both a beam of particles, and of waves in motion.
WAVE PARTICLE DUALITY:
All carriers of energy and momentum, such as light and electrons, propagate like a wave and exchange energy like a particle.
It wasn't until the 19th century that convincing evidence was found showing that light behaves like waves.
Before reading on, you may wish to review some wave terminology.
The key to understanding why light behaves like waves is in INTERFERENCE and DIFFRACTION.
Interference and Diffraction are the phenomena that distinguish waves from particles: waves interfere and diffract, particles do not.
Light bends around obstacles like waves do, and it is this bending which causes the single slit diffraction pattern.
Some assumptions must be made for this description of the single slit diffraction pattern:
- The slit size is small, relative to the wavelength of light.
- The screen is far away.
- Cylindrical waves can be represented in 2D diagrams as cicular waves.
- The intensity at any point on the screen is independent of the angle made between the ray to the screen and the normal line between the slit and the screen (this angle is called T below). This is possible because the slit is narrow.
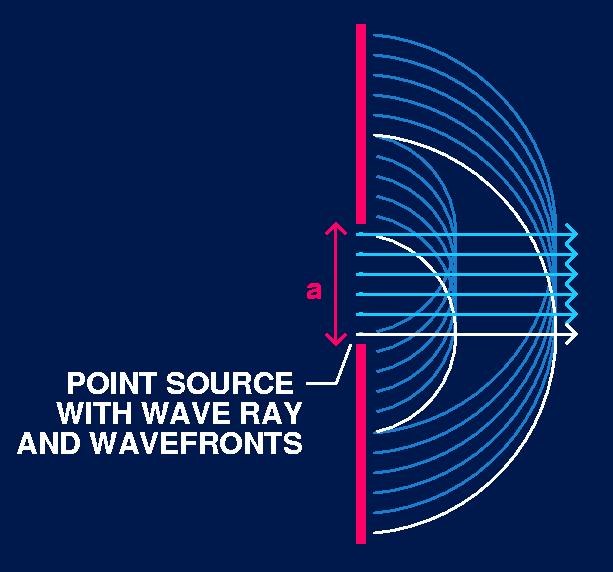
Consider a slit of width a, light of wavelength l, and a smaller than l.
When the light encounters the slit, the pattern of the resulting wave can be calculated by treating each point in the aperature as a point source from which new waves spread out.
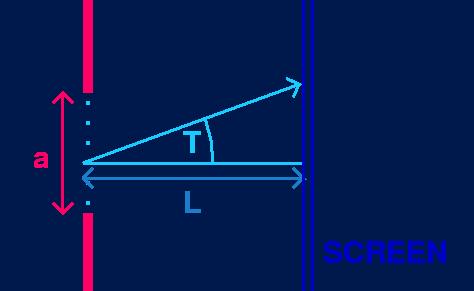
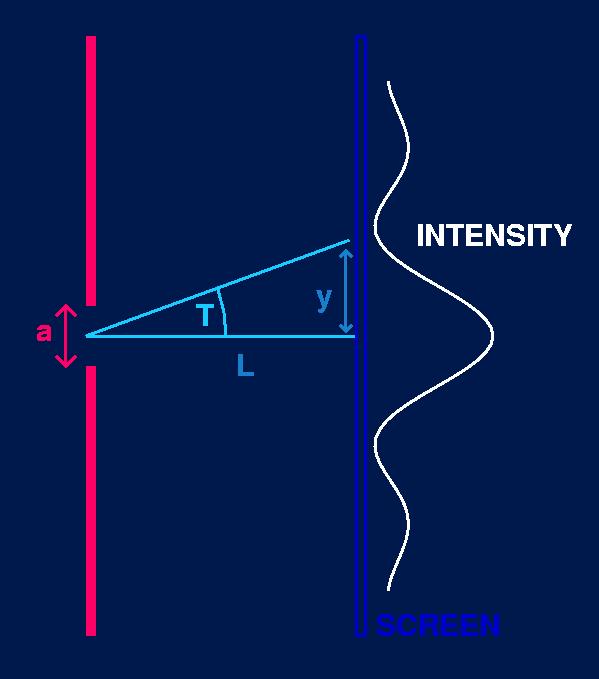
Let L represent the distance between the slit and the screen.
Let T represent the angle between the wave ray to a point on the screen
and the normal line between the slit and the screen.
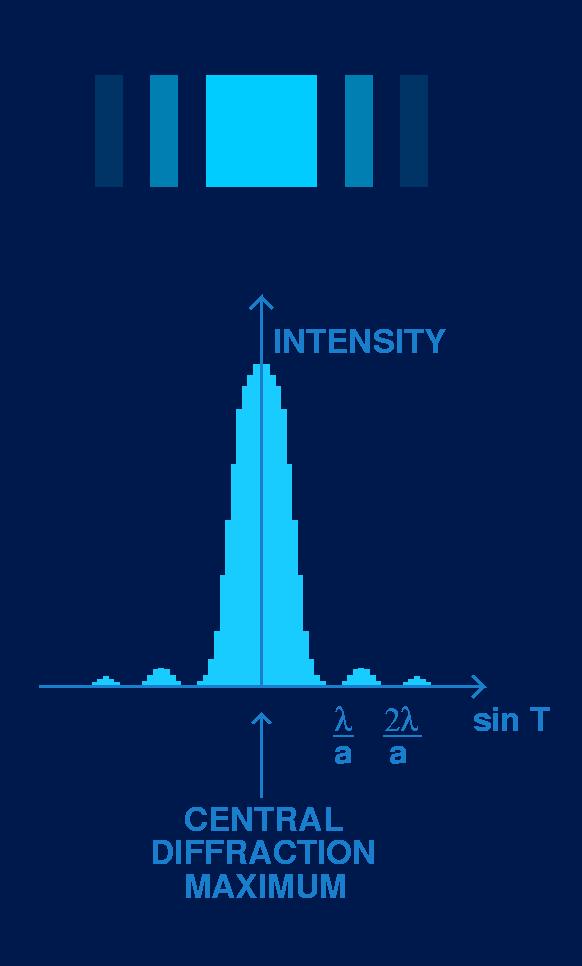
The top part of the figure to the left is an imitation of a single slit diffraction pattern which may be observed on the screen (there would really be more blending between the bright and dark bands, see a real diffraction pattern at the top of this page).
Below the pattern is an intensity bar graph showing the intensity of the light in the diffraction pattern as a function of sin T.
Most of the light is concentrated in the broad CENTRAL DIFFRACTION MAXIMUM.
There are minor seconday bands on either side of the central maximum.
The first DIFFRACTION MINIMUM occurs at the angles given by sin T = l / a
I will mention now that the intensity of light is proportional to the square of its amplitude. This will come into play later on.
With the equation:
sin T = l / a (*)
note that the width of the central diffraction maximum is inversely proportional to the width of the slit. If we increase the width size, a, the angle T at which the intensity first becomes zero decreases, resulting in a narrower central band. And if we make the slit width smaller, the angle T increases, giving a wider central band.
But why are there these bands of light?
And how can we derive the equation (*) for the location of the central diffraction minimum?
The equation (*) is the result of analysis of the PATH DIFFERENCE between light rays coming from the top and the bottom of the slit, and how this path difference relates to our discussion on INTERFERENCE.
Recall that we are considering points within the aperature as point sources from which new waves spread out. In the diagrams below the waves have been drawn from a side view, rather than a top view of wavefronts. This is to help us compare the phase of the waves.
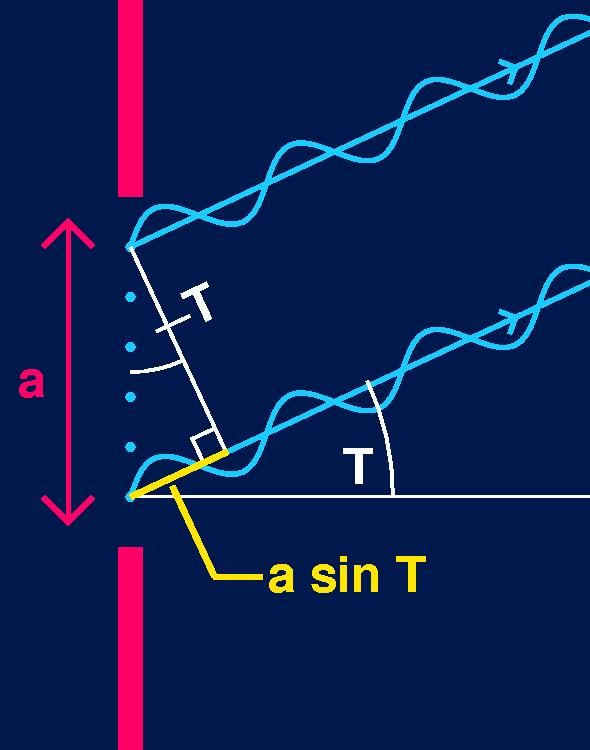
The quantity a sin T is called the path difference between the two light rays. We can see that along the parallel wave rays, the bottom wave has already completed about two-thirds of its cycle when the top wave begins its cycle. This means that in this diagram the two light rays have a path difference of about 2/3 x 2p or 4p / 3.
Now, remember that the slit width, a, is only a few hundred nanometers in size. And so even the light waves from the very top and very bottom of the slit are essentially right on top of each other, as well as all the waves inbetween. This means that they interfere, and the resultant wave's amplitude equals the sum of the individual wave amplitudes, by the superposition of waves.
This also means that for the top and bottom light waves, their phase difference is equal to their path difference, which in this example is about 4p / 3.
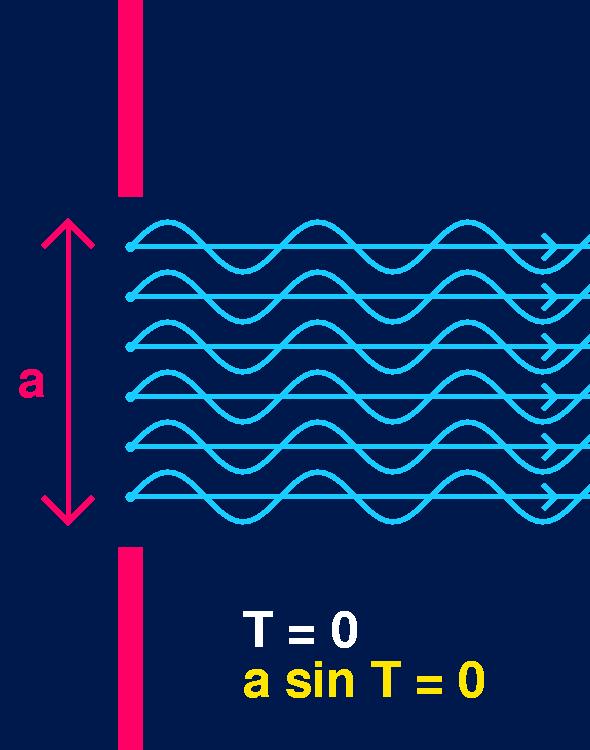
At T = 0, when the wave rays follow the normal line directly to the screen, a sin T = 0. This means that the path difference and the phase difference of all the waves is zero. Hence the waves are all in phase, and constructive interference has the resultant wave's amplitude equal to the sum of all the individual wave's amplitudes.
This explains the very bright central band around sin T = 0. With all the waves in phase, we have the largest resultant wave amplitude possible. And since the intensity of light is proportional to the square of its amplitude, the pattern on the screen has a very intense central band at this angle, that is when T = 0.
As T varies slightly from zero, a sin T also varies slightly from zero, as does the phase difference of the waves. This results in the interference of all the waves being not totally constructive, and so the intesity of the central band decreases while moving slightly away from sin T = 0, as we saw in the intesity bar graph above.

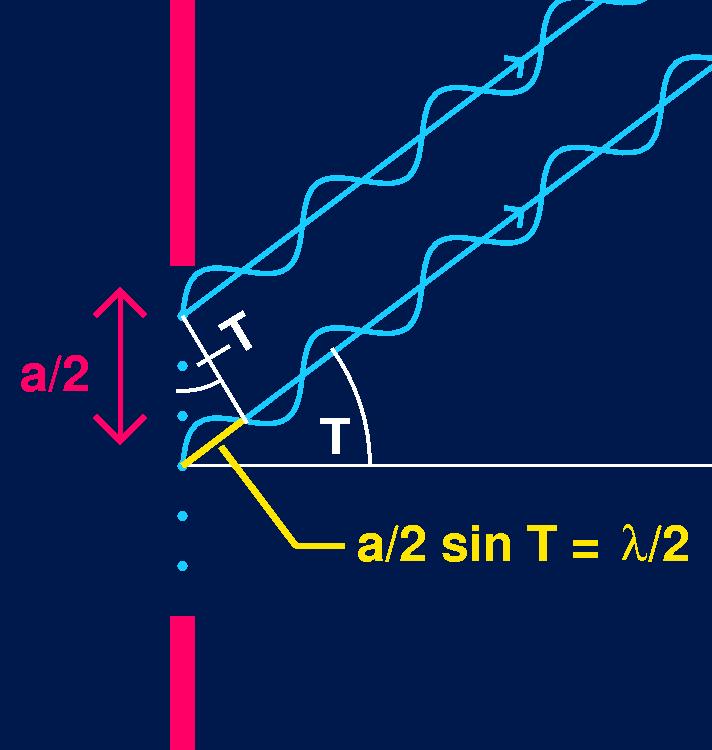
When a sin T = l, something special happens. Here the path difference between the top and bottom light rays equals one wavelength (l). That is, they are in phase. (Left figure)
This means that the path difference between the top ray and the ray just below the midpoint of the slit (a/2), is half a wavelength (l/2). (Right figure)
And a path difference of half a wavelength corresponds to a phase difference of p. That is, the top wave, and the wave just below the midpoint of the slit, are out of phase, and therefore cancel each other out.
Let us consider many point sources, say 2k, equally spaced within the slit opening so that there are 1 to k above the midpoint and k+1 to 2k below. Then when a sin T = l, waves 1 and k+1 are out of phase and so cancel each other out, as do waves 2 and k+2, and 3 and k+3 ... through to waves k and 2k. And so all waves cancel, and thus the resultant wave has an amplitude of zero. An amplitude of zero means zero intesity, and so the first diffraction minimum occurs at a sin T = l, or sin T = l / a, which was our (*) above.
This argument can be extended to explain the second and third and other diffraction minima. At the angle when a sin T = 2l, we can divide the slit into four regions of point sources, two above the midpoint and two below. Then, using the argument above, the total intensity of the top two regions is zero due to cancellation of pairs of sources, and the same goes for the bottom two regions.
And so, the general equation for the points of zero intensity in the diffraction pattern of a single slit is:
a sin T = ml m = 1,2,3, ...