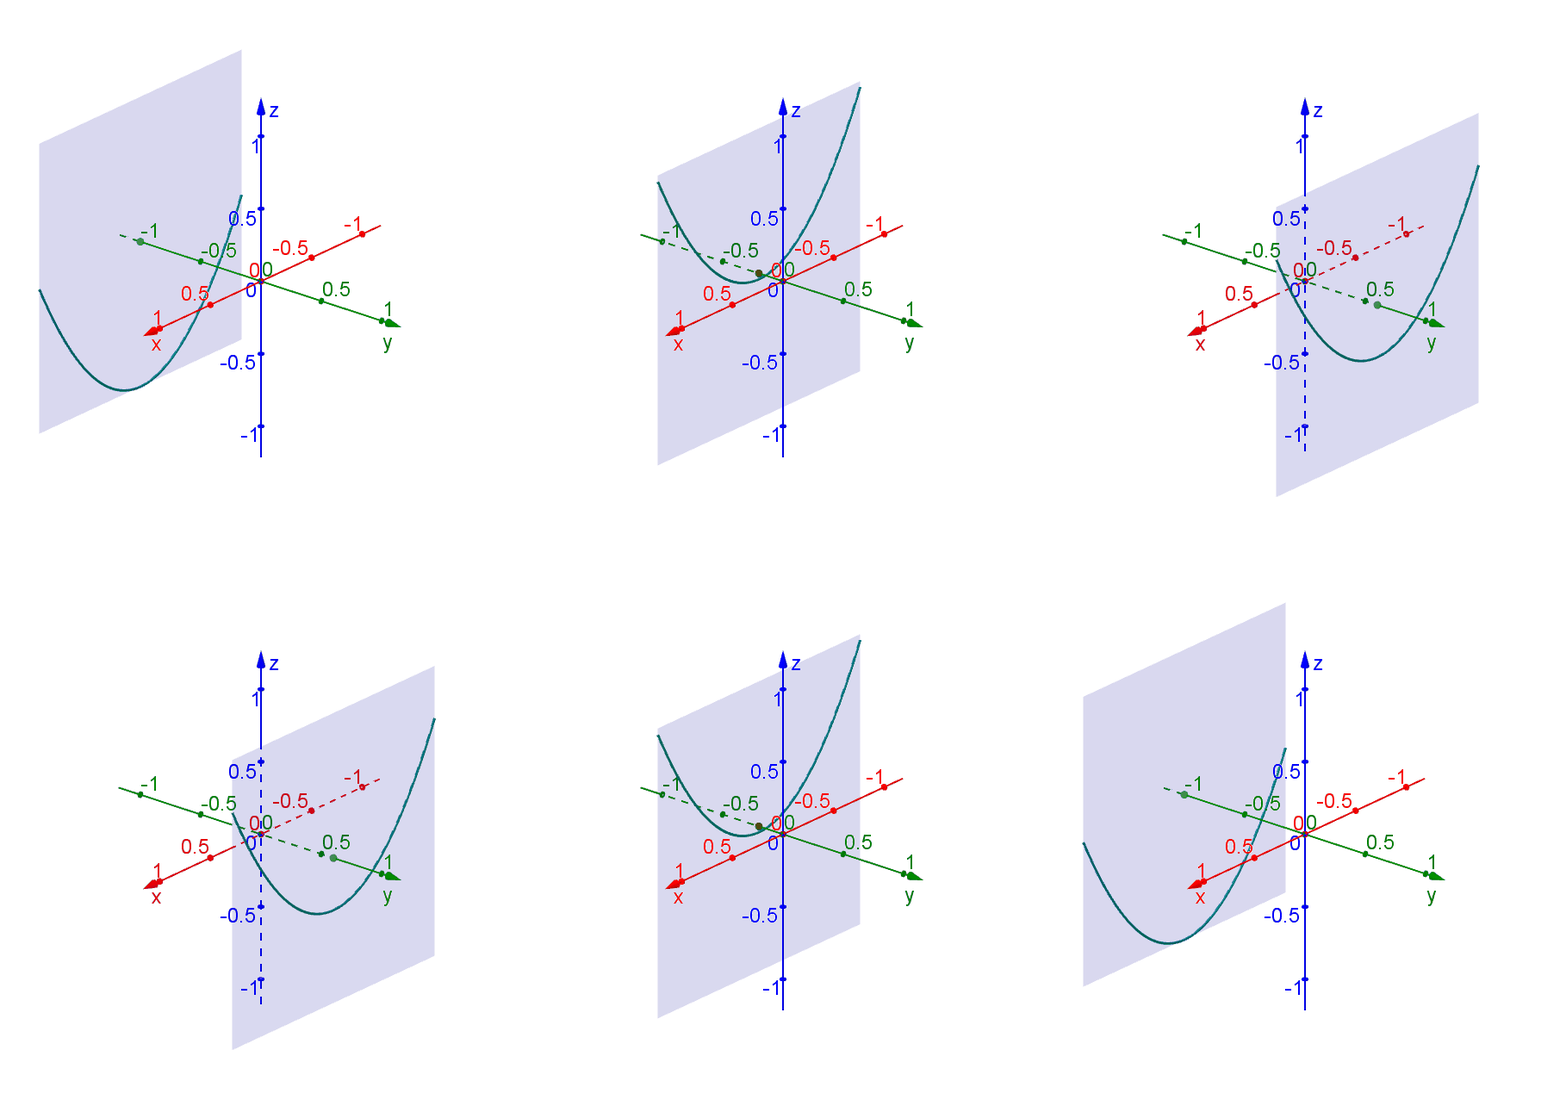
Scroll down to the bottom to view the interactive graph.
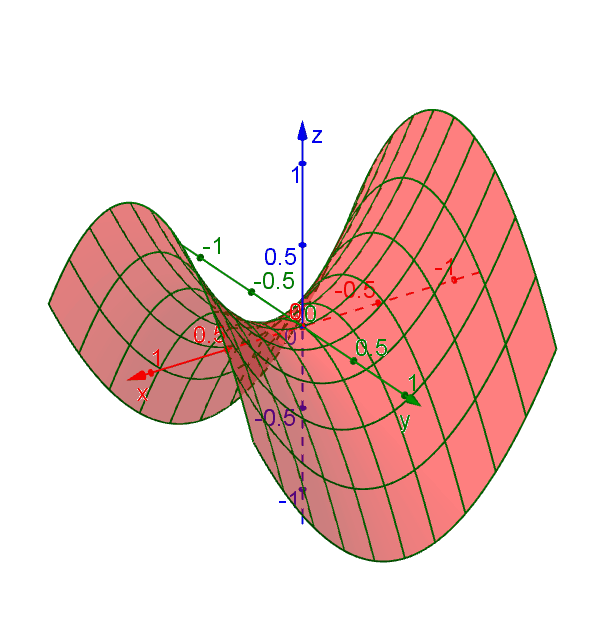
Consider the function \[f(x,y) = x^2 - y^2.\] To illustrate the surface \(z = f(x,y)\), we can try to imagine how the traces look like when fixing \(x\) or \(y\). For example, if we fix \(y\), i.e. set \[y = k = \text{constant,}\] then the trace along the surface is defined by \(z = f(x,k) = x^2 -k^2\), which is a parabola opening upward and shifted down by \(k^2\).

The shape of the surface will be apparent if we put all the traces together.

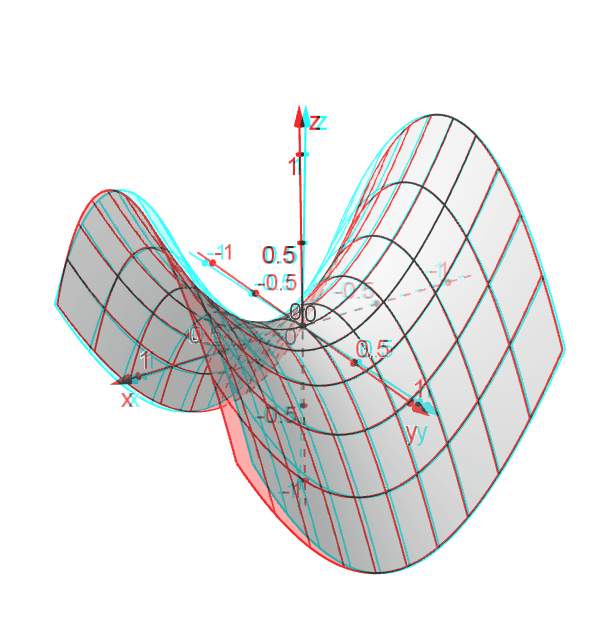
You may see this in 3D if you have a pair of red-cyan 3D glasses.

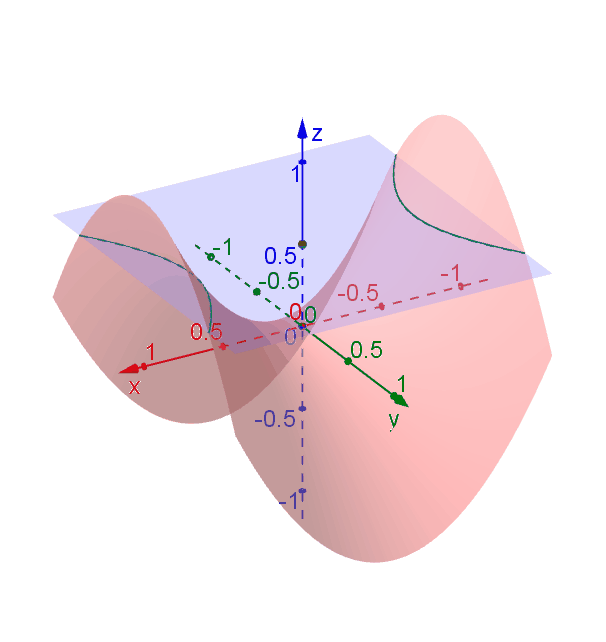
This surface is called a hyperbolic paraboloid because the traces parallel to the \(xz\)- and \(yz\)-planes are parabolas and the level curves (traces parallel to the \(xy\)-plane) are hyperbolas. The following figure shows the hyperbolic shape of a level curve.

To view the interactive graph:
To rotate the graph, right click and drag.
Joseph Lo