Inflating Away the Imbalance
|
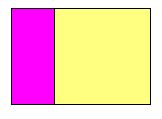
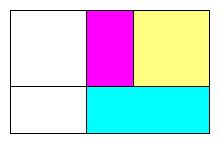
Inflating a rectangle means adding a square to its longer side -- as shown on the right, where the original rectangle
is purple, while the added square is yellow. The enlarged rectangle will be referred to as the inflation of the old one. This is not standard terminology -- it is made up ad hoc for the sole purpose of making this text easier to read. (Mathematics allows that kind of poetic licence, as long as it is consistent.) We want to study the way inflation affects the shape of a rectangle. If it remains unaltered, we say (and so does everyone else) the rectangle is golden. |
|
We shall eventually see that continued inflation leads to a more and more golden shape. But what does that mean? How can we compare the shapes of rectangles and check that one is "more golden" than another?
|
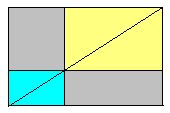
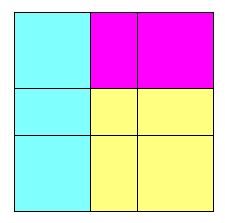
Of course we all know that rectangles come in various shapes, from squat squares to the thinnest strips. Here is how we can compare them: when two rectangles have the same shape -- like the blue and the yellow depicted on the left -- their diagonals line up as shown, splitting the whole diagram exactly in half. The two grey areas must therefore be equal. |
|
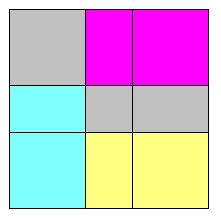
If the blue and yellow shapes are not the same, their diagonals do not line up, and the complementary grey areas are not equal. This is the situatuation shown above on the right.
|
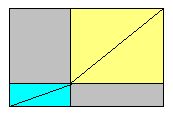
To compare the shape of a rectangle with the shape of its inflation, we therefore have to look at a diagram like the one on the left, where the blue and purple rectangles are "equal" (i.e., congruent). The difference between the areas of the upper grey square and the lower grey strip will be called the imbalance of the purple rectangle.
|
|
This is another ad hoc definition intended to simplify the language. In some sense, the imbalance of a rectangle measures how far it is from being golden. It is zero in the golden case.
The grey square and strip in the left diagram above show up again -- coloured yellow and blue, respectively -- in the right diagram (make sure you can argue this in detail!). This suggest another way of defining the imbalance of the purple rectangle: it is the difference between the areas of (a) the square that must be added to inflate it and (b) the strip that must be added to the inflation to complete the larger square.
|
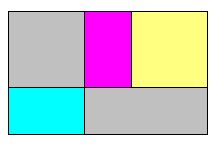
Now let us look at the imbalance of the inflation, shown all in purple on the left. The square used to inflate the inflation is yellow, the strip required to complete the larger square is blue. What is the difference between the areas of these two items? The answer is visible on the right: since the blue and yellow rectangles shown there are congruent, they contribute nothing to the new imbalance. It is still based on the difference of the two grey areas -- just like the old one!
|
|
Conclusion: inflation does not change the size of the imbalance. In particular, inflation keeps golden rectangles golden. Even better: since continued inflation keeps pumping up the area without changing the imbalance, the latter fades into insignificance compared to the size of the rectangles. More concretely: in the last four diagrams
above, the imbalance happens to be five (square) pixels -- a puny amount if we keep inflating the rectangles to wall size. In the end, our rectangles will -- for all practical purposes -- be golden.
Back to the Rabbits.
So, where is the promised insight into the Fibonacci numbers? Well -- if you attach a square to the longer side of a one-by-two rectangle, you get a two-by-three rectangle; further inflation yields a
three-by-five rectangle -- and so on, generating the sequence
1, 2, 3, 5, 8, 13, 21, 34, 55, 89, 144, 233, 377, ...
already seen on the previous page. Comparing the square of any of these numbers with the product of its two neighbours, you always get a difference of 1. That is the imbalance.
If, however, you begin with a one-by-three rectangle, continued inflation will spawn the
Lucas sequence,
1, 3, 4, 7, 11, 18, 29, 47, 76, 123, 199, 322, ...
named after the French number wizard
Edouard Lucas, who lived in the nineteenth century. Its imbalance is 5, and of course, it too marches toward the divine proportion.
Algebraically the preservation of the imbalance is very easy to see. After all, we are dealing
here with number sequences
a, b, c, d, ... with c = a+b and d = b+c = a+2b.
The imbalance for a, b, c is b2 - ac = b2 - a(a+b). For b, c, d it is c2 - bd = (a+b)2 - b(a+2b), which comes to ac - b2,
as you can (and should) easily check. In other words, its size remains constant but it changes from plus to minus and
vice versa. Can you see this switching of signs in the pictorial proof above? How would you compare this algebraic proof with the geometric one? Would the conclusions of this comparison hold in every case where both algebra and geometry can be used?
Try to come up with examples ...
What about the perfectly golden case, with zero imbalance: b2 = a(a+b) ?
Is this possible with integers a and b? Remember: an a-by-b rectangle would be golden, and
could be "deflated" (as in Figure 2 of the previous page) ad infinitum -- always keeping integer values for its sides. Could that be?