Function: curvarrows - plot a 2D or 3D curve (parametric or cartesian) with arrows from a vector field at points on the curve.
Calling sequence:
curvarrows(fld,curv,t=a..b);
Parameters:
fld
- the vector field, either a
![]() -component list or vector expression in the parameter
t
(specifying the vectors in terms of the parameter) or a function of
-component list or vector expression in the parameter
t
(specifying the vectors in terms of the parameter) or a function of
![]() variables whose values are
variables whose values are
![]() -component lists or vectors (specifying the vector field in terms of Cartesian coordinates), where
-component lists or vectors (specifying the vector field in terms of Cartesian coordinates), where
![]() is 2 or 3.
is 2 or 3.
curv
- the curve, either a
![]() -component list or vector expression in the parameter
t
(for a parametric representation of the curve) or a scalar expression in
t
(representing the
-component list or vector expression in the parameter
t
(for a parametric representation of the curve) or a scalar expression in
t
(representing the
![]() coordinate while
t
is the
coordinate while
t
is the
![]() coordinate).
coordinate).
t - name for the parameter.
a , b - real constants, endpoints for the parameter interval.
Optional arguments:
arrownum=
![]() for
for
![]() arrows along the curve, equally spaced in terms of the parameter (default is
arrownum=10
)
arrows along the curve, equally spaced in terms of the parameter (default is
arrownum=10
)
scalefactor=
![]() to multiply arrow lengths by real constant
to multiply arrow lengths by real constant
![]() .
.
arrowthickness=
![]() for thickness of the arrow shaft (
for thickness of the arrow shaft (
![]() should be 0, 1, 2 or 3, default is the same as the
thickness
option if specified, or 3 if not).
should be 0, 1, 2 or 3, default is the same as the
thickness
option if specified, or 3 if not).
arrowcolour=
![]() to specify arrow colour (default is the same as the
colour
option if specified, or red if not). The alternate spelling
arrowcolor
is allowed.
to specify arrow colour (default is the same as the
colour
option if specified, or red if not). The alternate spelling
arrowcolor
is allowed.
other 2D or 3D curve plotting options
Description:
This function creates a 2D or 3D plot data object which consists of a curve specified by curv for t = a .. b (including all options of the curvarrows command except arrownum , scalefactor , arrowthickness and arrowcolour ), plus arrows representing the vector field fld drawn at points on the curve.
The curve is drawn using plot (in either the parametric or Cartesian form) for the 2D case, or spacecurve for the 3D case.
Unless the option scaling=constrained ("Projection, Constrained" on the plot menu or "1-1" on the context bar) is used, the shapes of the arrowheads may be distorted.
This function is part of the package surfarro in the Maple Advisor Database library, and must be loaded before use by the command with(surfarro); or with(surfarro,curvarrows);
Examples:
> with(surfarro,curvarrows):
Curve is a circle represented parametrically, vectors are tangent.
>
curv1:= [cos(t),sin(t)];
F1:= diff(curv1,t);
curvarrows(F1, curv1, t = 0 .. 2*Pi, arrowcolour=blue,
scalefactor=1/2, arrowthickness=1, scaling=constrained);
![]()
![]()

Curve is a semicircle represented in Cartesian coordinates, vectors are normal.
>
curv2:= sqrt(1-x^2);
F2:= [x,curv2];
curvarrows(F2,curv2, x = -1 .. 1,
scalefactor=1/3, scaling=constrained);
![]()
![]()

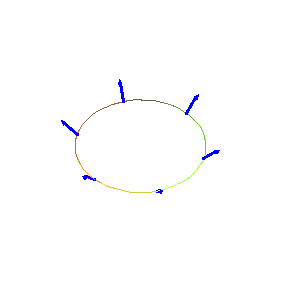
Parametric 3D curve, vector field is a function of
![]() ,
,
![]() and
and
![]() coordinates. Note that 6 arrows appear because the arrows at the beginning and end of the parameter interval coincide.
coordinates. Note that 6 arrows appear because the arrows at the beginning and end of the parameter interval coincide.
>
curv3:= [cos(t), sin(t), 1];
F3:= (x,y,z) -> [x, y, z];
curvarrows(F3,curv3, t = 0 .. 2*Pi,
arrowcolour=blue, scalefactor = 1/4, arrownum = 7, scaling=constrained);
![]()
![]()

See also: arrow2d, arrow3d , surfarrows, plot , plot[parametric] , spacecurve
Maple Advisor Database R. Israel 1998