Advice: Plotting to a file or a printer
There are various ways to obtain a printed copy of a plot, depending on your system. One convenient method is to plot into a window (use Plot Display... Window from the Options menu, or the command plotsetup(window); ) and then use Print from the File menu. Alternatively, you can select a plot (whether window or inline) with the mouse, copy it to the clipboard (with Copy from the Edit menu or whatever keystrokes do this on your system, such as Control-C), paste it into some graphics application, such as Paintbrush in Microsoft Windows, and print from there. A third alternative is to use Export As... HTML from the File menu. This makes an html version of the worksheet (which can be viewed in a Web browser), with the plots as gif files in an "images" subdirectory. The plot files can be used independently of the rest of the worksheet.
One disadvantage of these methods is that, because the printed image is just a pixel-by-pixel copy of the image on the screen, its resolution is limited. You may notice that what should be smooth curves and straight lines have jagged edges. Your printer may be able to do much better than that. To take better advantage of its capabilities, you need to make a graphics file using one of the plot devices that Maple has available. See the help page plot,device for a description of these, as well as the options available.
You will need to know what types of graphics file your system can print. PostScript ( ps ) and hpgl are very good choices if your system can use them. On the other hand, gif , jpeg and pcx , which require Maple to construct a bitmapped image in memory, are limited in resolution. If Maple does not support a format your system can print, you may be able to produce one type of file and convert it to another: there are many shareware and commercial products that can convert between the various graphics file formats.
Generally you should first produce the plot you want on the screen, making sure that everything is as it should be. Then save the plot structure by assigning it to a variable. For example,
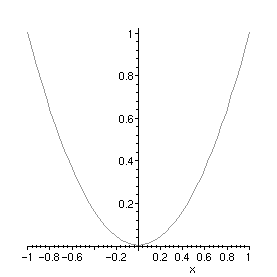
> plot(x^2, x = -1 .. 1);

> myplot:= %:
Note the colon, to avoid having Maple print out the plot structure. Now set up the plot device, together with the name of the output file and any options. In particular, the height and width options will determine the size of the printed output. This is given in points for PostScript output (1 inch = 72 points, 1 cm = 28.35 points), and pixels for gif, jpeg or pcx. The plotoptions string must not include spaces.
> plotsetup(gif, plotoutput=`myplot.gif`, plotoptions="height=300,width=600");
Now recall the plot structure from the variable where it was saved, and it will be printed to the output file.
> myplot;
The plot data may not always show up right away in the file, because it is being cached somewhere in the system. In order to close the file, switch to a different plotoutput or a different plot device.
> plotsetup(inline);
This goes back to inline plots in the worksheet.
You may find that you want to adjust the sizes and styles of type for titles, axis labels and other text in your graph, as the relative sizes may be different on the screen and in printed output. You should be able to do this in the command that produced the original plot, using the titlefont (for titles), axesfont (for the numbers beside the tickmarks), labelfont (for the axis labels) and font (for text produced with textplot) options. For example, you might replace the last plot command with
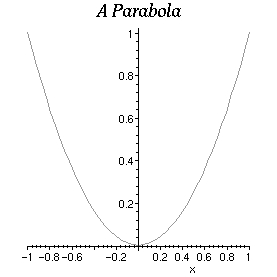
> plot(x^2, x=-1..1, title="A Parabola", axesfont=[HELVETICA,8], titlefont=[TIMES,ITALIC,18]);

Unfortunately, however, this does not seem to have any effect with most of the bitmapped plot devices. They don't even include the title at all. It does work with PostScript. Note that titles, fonts etc. work in gif files produced by Export As... HTML.
See also: How To , plot[devices] , plotsetup , plot[options] , Greek letters and other symbols in plots
Maple Advisor Database R. Israel, 1998