Let u(n) be the maximal number of unit distances present in a planar graph with n vertices. Download the list of these bounds here. When looking at the text files, note that a 'unit distance' in my program is 75.
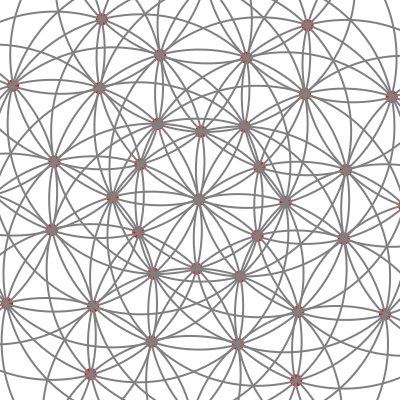
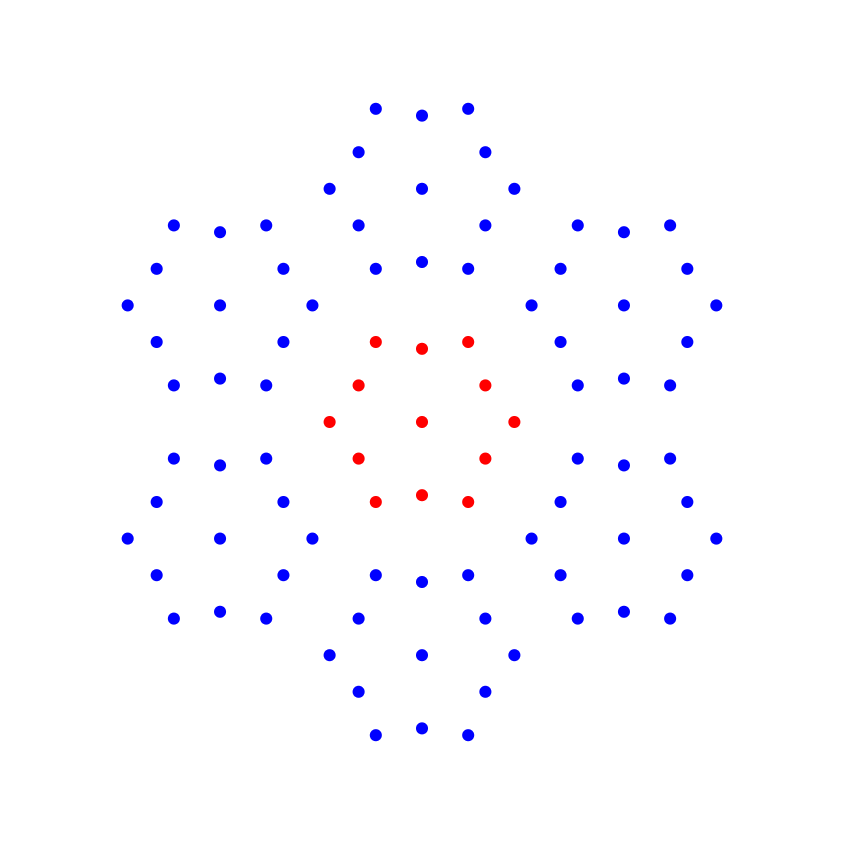
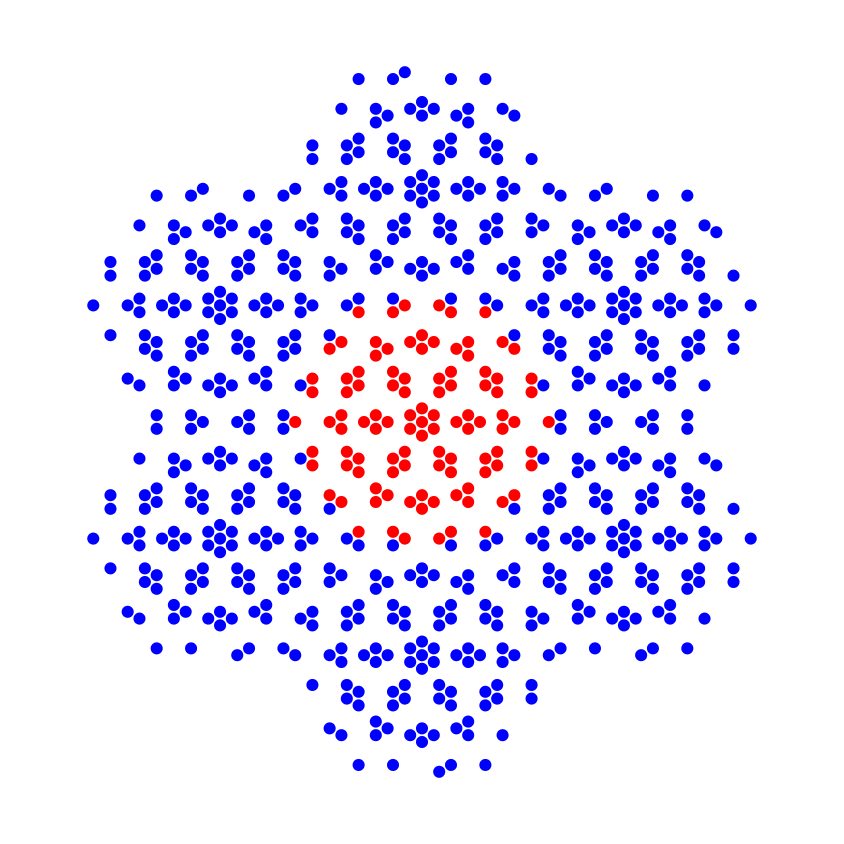
| u(n) lower bounds | Point set images | + lines | Download points |
|---|
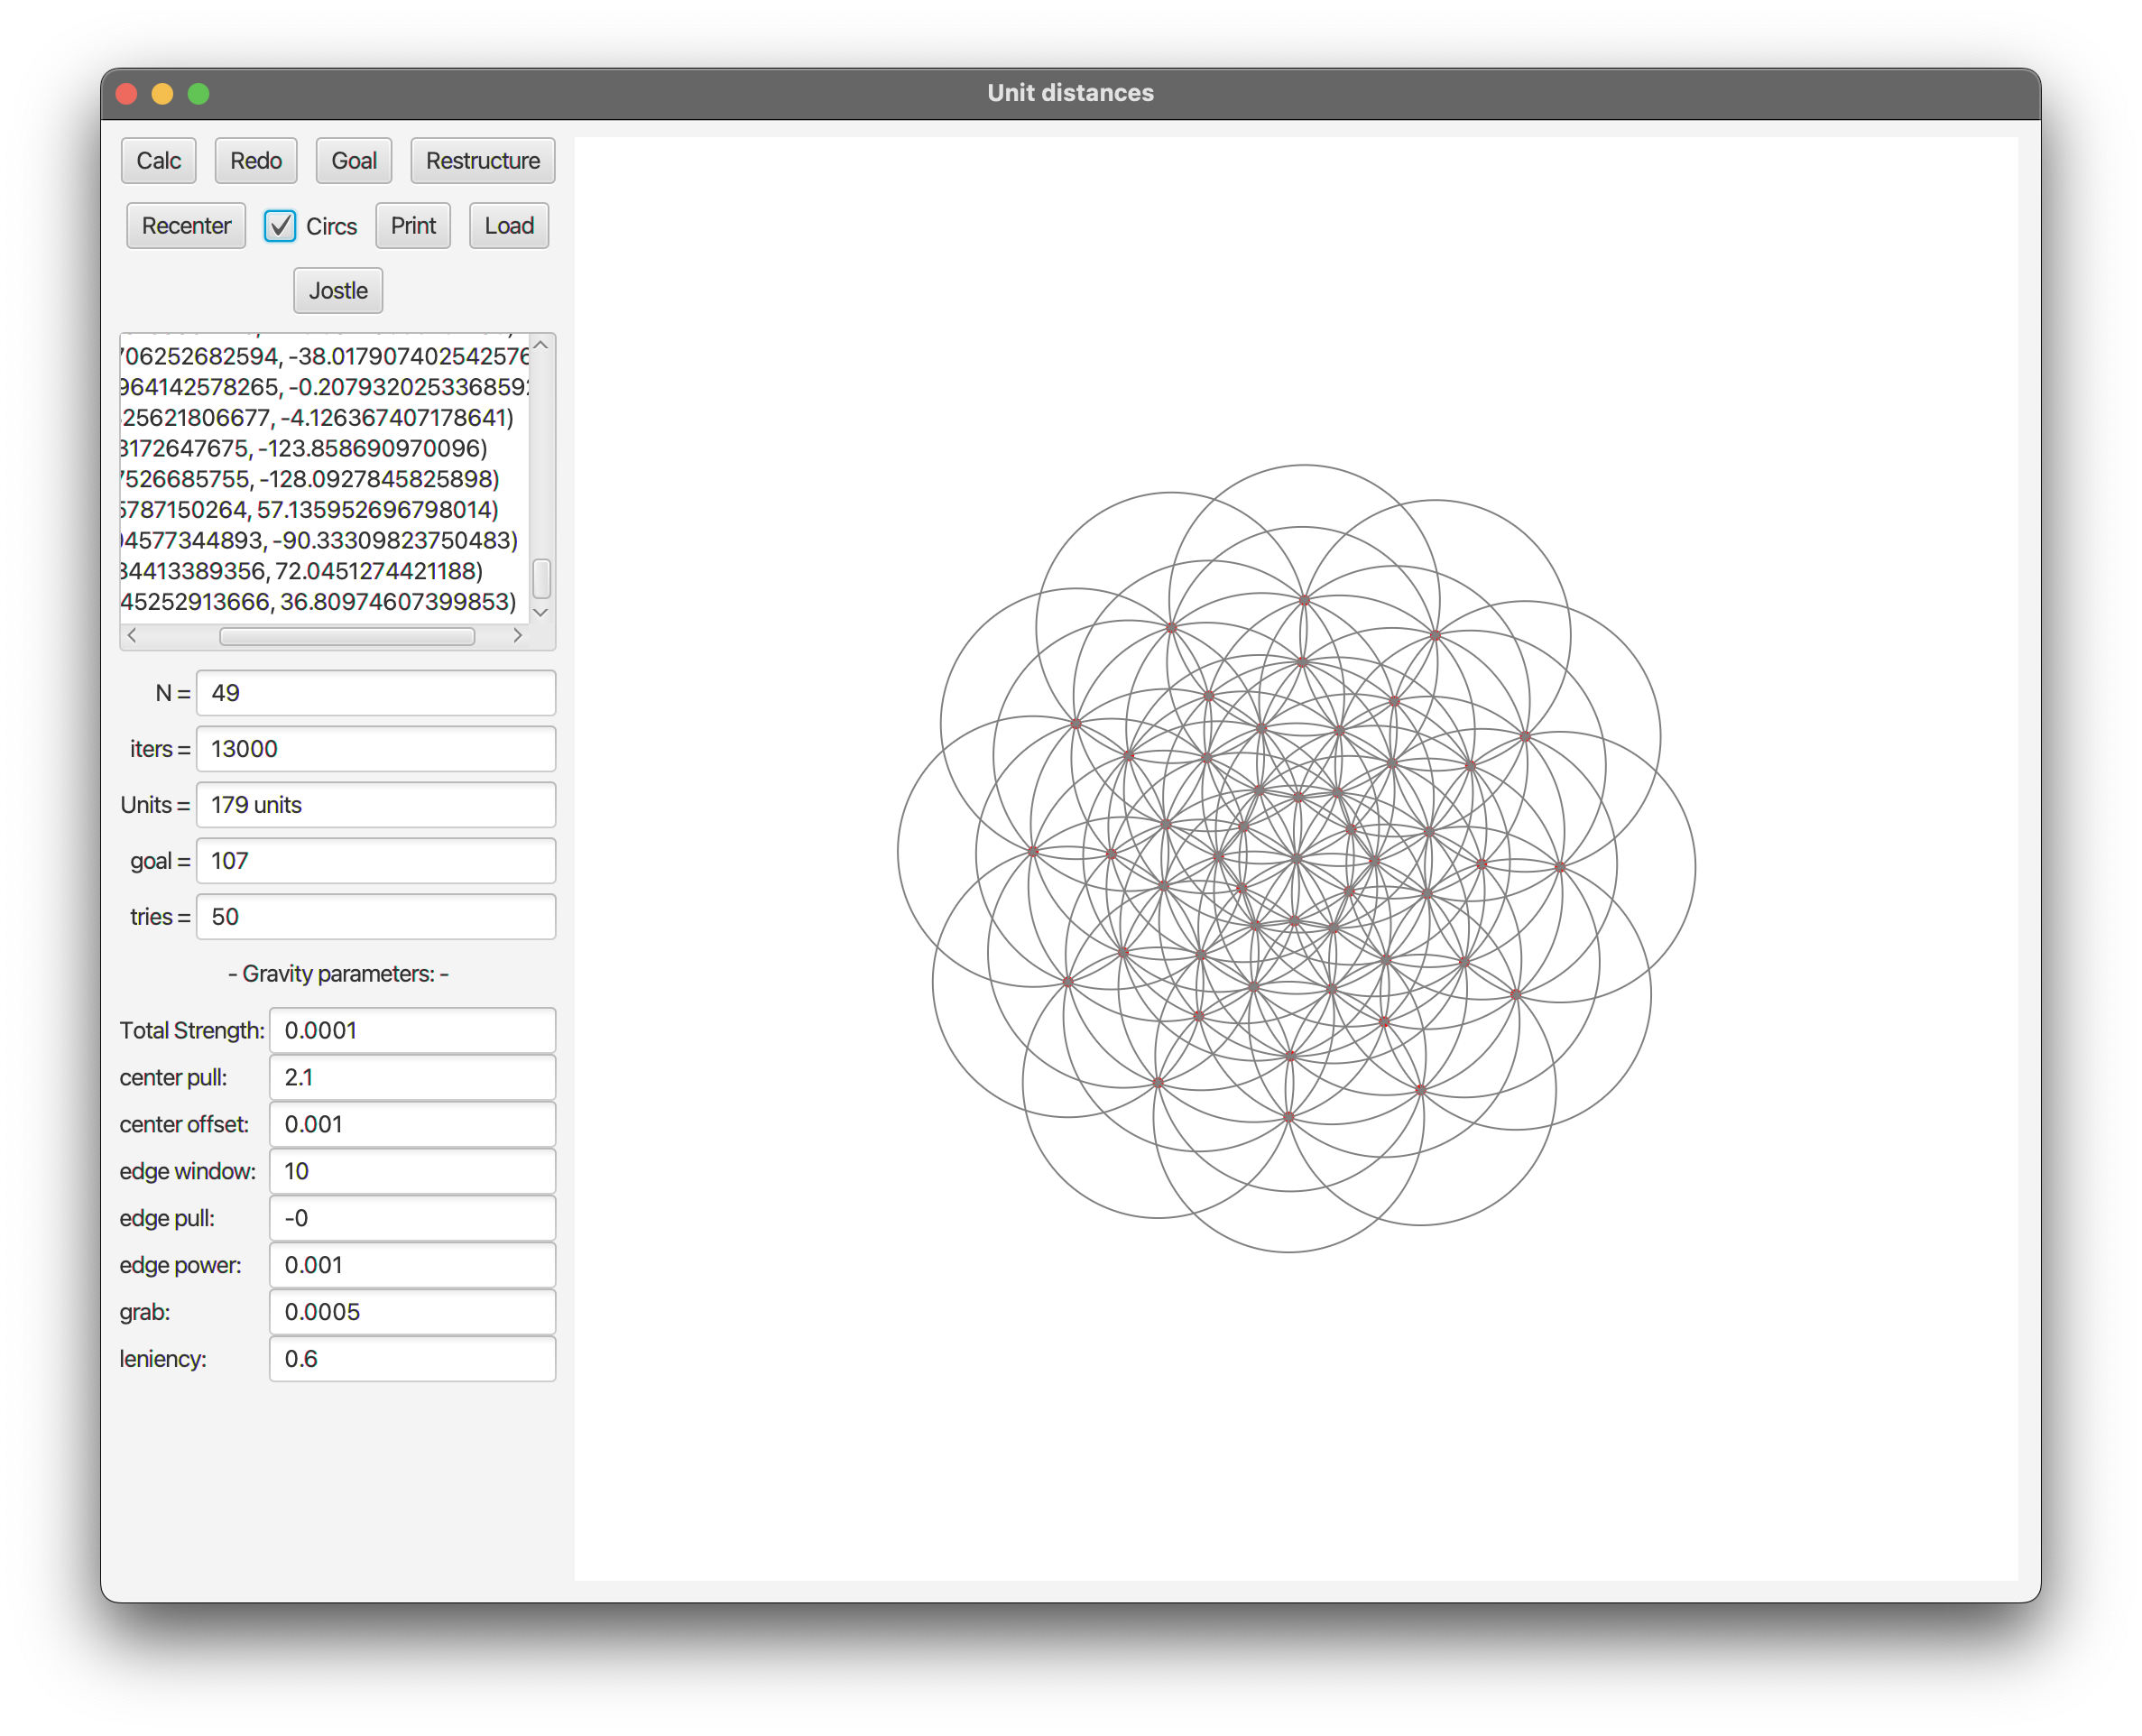
This program runs a pair of algorithms that find dense unit distance graphs. One is a 'gravity simulation', moving points closer together if they are more than a unit distance apart, and further apart if not. With a very particular choice of gravity function, this process is stable, and by regularly perturbing the points this can find the small (n < 40) examples I gave by itself.
To go higher, we use an optimization which simply looks for points in our set that are not very rich with unit circles, and moves them to places that are. When n is larger, as the previous algorithm settles on a set that is very stable, there are always suboptimal placements. This second process fights that very well.
The values for n up to 30 were known previously, and the values 1-14 were proven to be optimal by Schade in '93. In this paper, the authors show values up to n=30. Additionally, in this paper about the chromatic number of the plane, the authors critically use the same graph I found for 49 vertices, without mentioning that it may be the extremal example. Finally, in this paper by Peter Engel, Owen Hammond-Lee, Yiheng Su, Dániel Varga, and Pál Zsámboki, there are bounds up to 100 (matched in the table above).
(Better explanation in this section is coming. Graphs 36, 100, and 112 above are interesting!) It is notable that almost every set that I found was a subset of a particular grid-like thing, the so-called Moser lattice. In this paper the authors go into detail about what this lattice is.
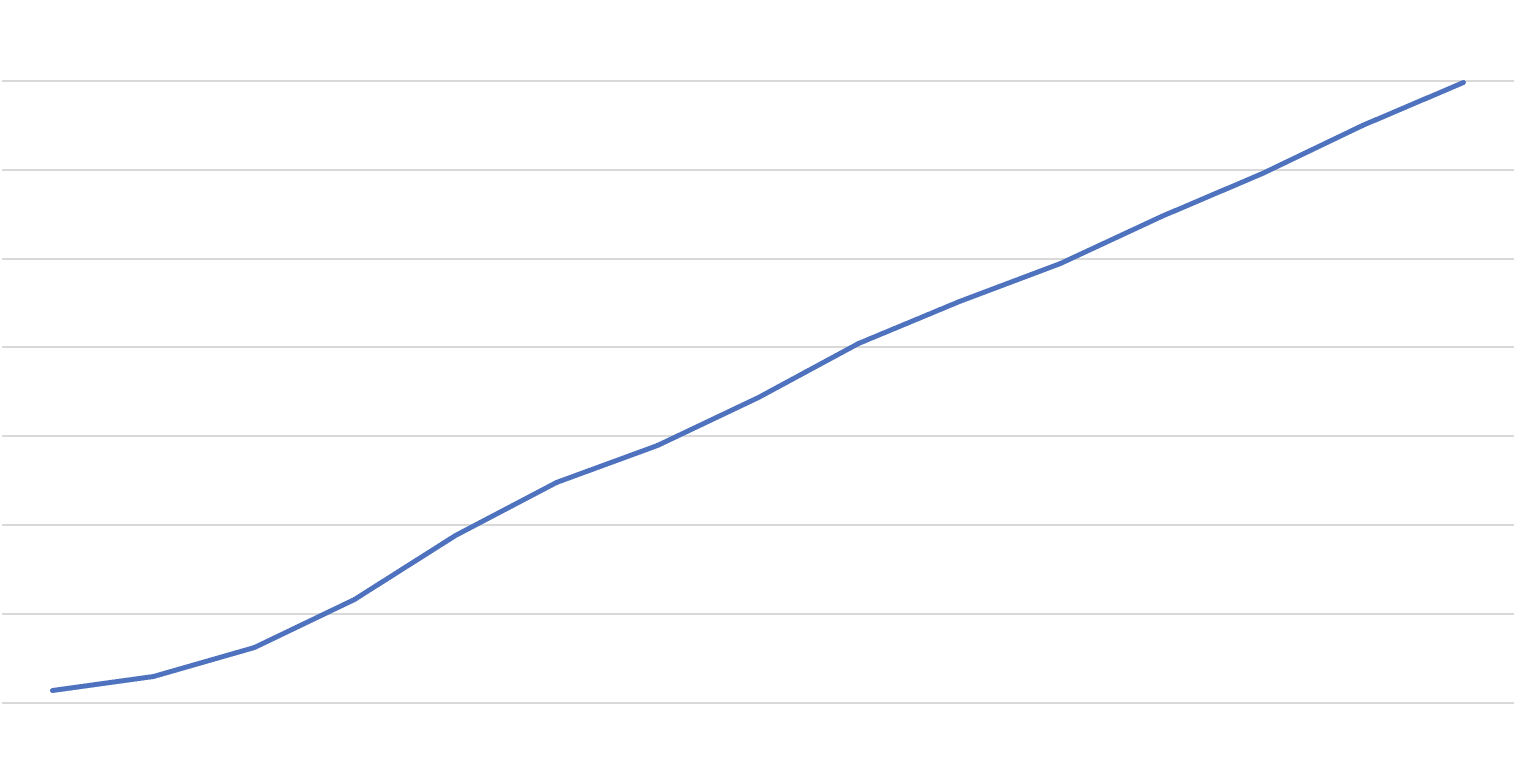
I wrote another program to just extrapolate based on my secondary optimization to get a better idea of the asymptotic growth, and sadly, the result appears to have linear growth. It seems the secondary optimization may only produce points within the Moser Lattice, which has a bounded max degree. You can see that initially, the growth looks like a very promising upward curve, but it soon becomes linear. So at some point, the square grid for example will provide graphs that are more dense.