| Malin's Magnificent Math |
|
Home
Radiometry Reflection Functions Illumination Models Ray Tracing |
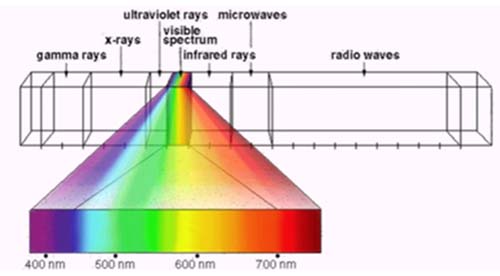
Colour: Physics and LightColour is Enegry:Electromagnetic Spectrum:Visible light consists of a spectral distribution
of electromagnetic energy having wavelengths in the range of 380-760
nm. Waves of light are measured in wavelengths, the length determining
its color. The perceived colour of visible light is to some extent
a subjective experience. Metamers are colours that are perceptually identical when viewed even though the spectra is different for the two colours. The perception of colour is only related to the stimulation of three different types of cones. Thus,if two different spectra stimulate the three cones the same way, the colours produced will not be distinguishable for the eye. Experiments have been carried out to determine
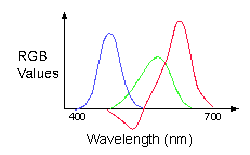
the amount of R, G, B values needed for a given wavelength. On one
side of the display a colour of a set wavelength is shown. Then
on the other side the subject must mix three other pure wavelenths
(such as R=700nm, G=546nm, and B=436nm) until the two sides of the
display look identical.
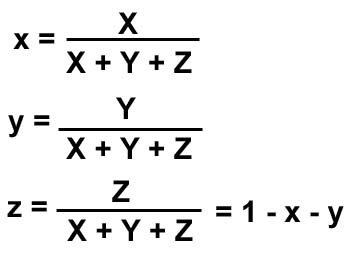
To convert the 3D colour space to 2D colour space,
project the 3D colour space onto the plane X + Y + X = 1, yielding
a CIE chromaticity diagram (shown below). The projection is given
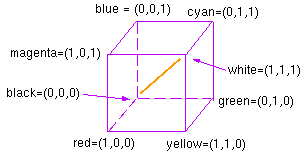
in the following equations: The RGB colour cube is used to represent the
additive colour model. R, G, and B represent the colours produced
by red, green, and blue phosphours.
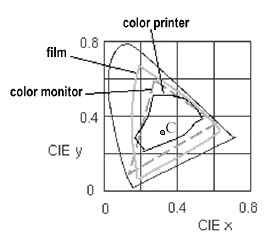
The RGB colour cube fits into the CIE XYZ
model, as shown below. |
